// nonfiction
- doc
- report
- 012
- filed
- 2026.09.28
- read
- 036 passes
- state
- [filed]
past native: vulkan, faster than dx11 in skyrim se
how a dxvk fork tuned for one game runs skyrim special edition faster than its own native dx11 at ultra 1080p.
status
| t+0.000 | headline | perf-max vs native, c76: whiterun +10.97%, flight +4.37%. 5 of 5 pairs each |
| t+0.001 | repeat | c80 reproduces it: +12.09% and +4.04%. 1.52x and 1.22x stock dxvk |
| t+0.002 | mods | same mods on both sides: the lead holds, and grows under community shaders |
| t+0.003 | strict | vanilla's exact image: level in whiterun, about 5.5% behind in the flight |
| t+0.004 | latency | lower on presentmon's clock. the two clocks differ. camera test next |
scope
written after 5 days and 18 hours of testing, 57.7k+ loc and 2,370 benchmark runs.
I forked dxvk, the layer that translates direct3d 11 into vulkan, and tuned that fork narrowly for skyrim special edition :3 the vulkan fork had to beat skyrim in its native dx11. the bar was ultra settings at 1080p.
the final numbers come from campaign c76, the hardened build:
| scene | native dx11 | our fork (perf-max) | paired difference (95% ci) | 1% lows | display latency |
|---|---|---|---|---|---|
| whiterun | 218.1 fps | 242.2 fps | +10.97% (+10.05 to +11.89), 5 of 5 pairs | 170 vs 164 | 4.6 ms vs 9.8 ms |
| flying traversal | 239.8 fps | 250.7 fps | +4.37% (+3.70 to +5.03), 5 of 5 pairs | 216 vs 204 | 4.7 ms vs 12.4 ms |
average frame rate goes to us in both scenes, and 1% lows led in c76. the independent repeat (c80) put the lows tied with native, while the frame-rate gain returned at +12.09% in whiterun and +4.04% in the traversal.
on presentmon’s display-latency clock the fork reads under half of native’s figure, a number with an asterisk the present-path section explains. that same repeat had stock dxvk 3.1.1, the version the project started from, 26% behind native in whiterun and 15% behind in the traversal. measured side by side, the fork therefore runs at 1.52 times stock in whiterun and 1.22 times in the traversal.
the project is two repositories:
- blessed-skyrim holds the benchmark harness (
bench/) and the skse plugin that patches the engine (skse/skybench). every campaign plan lives there too. the tuning report holds each number and its run id, plus the long writeup this report is set from. - blessed-dxvk is our fork of dxvk 3.1.1 on the
blessedbranch, home of the translation-layer work. the constant-buffer ring and mirror, threaded front end, present path, the shader replacements and the temporal levers all live in it.
the fork delivers most of the speed. the plugin brings the engine-side patches a translation layer cannot reach, like the cascade walk and the half-rate far cascade.
the rig
it ran on one mid-range machine:
- rtx 3060 ti, driver 596.36
- ryzen 5 5600 (6 cores), 32gb of ddr4 ram
- a 75 Hz monitor
- windows 11 stripped
- skyrim se 1.7.104 with skse 2.3.1
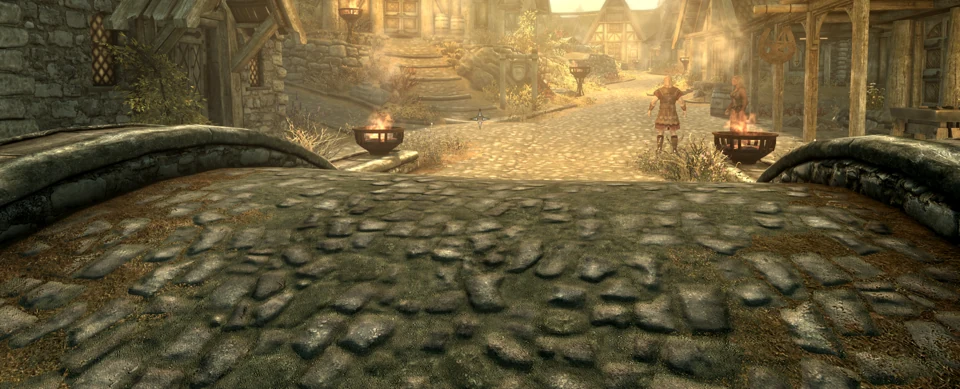
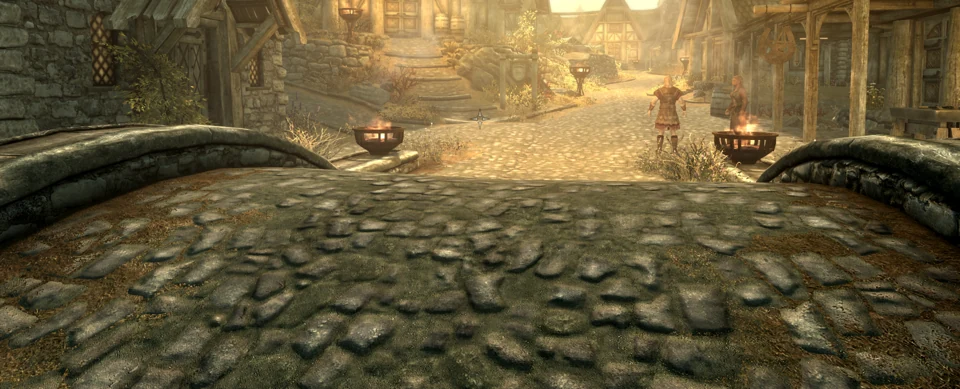
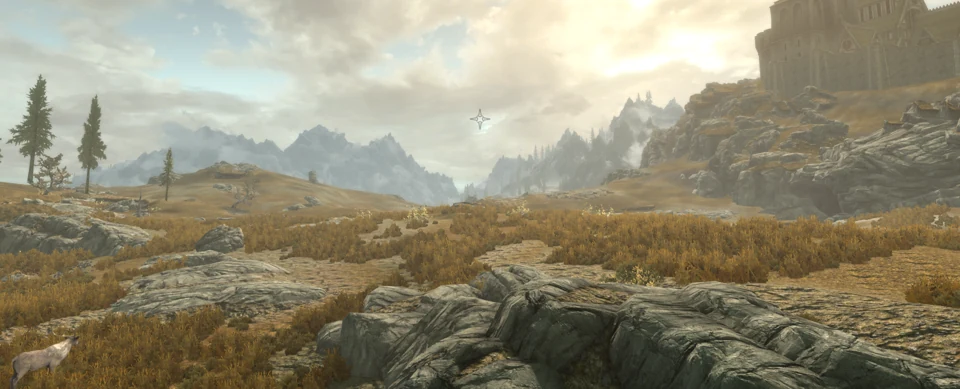
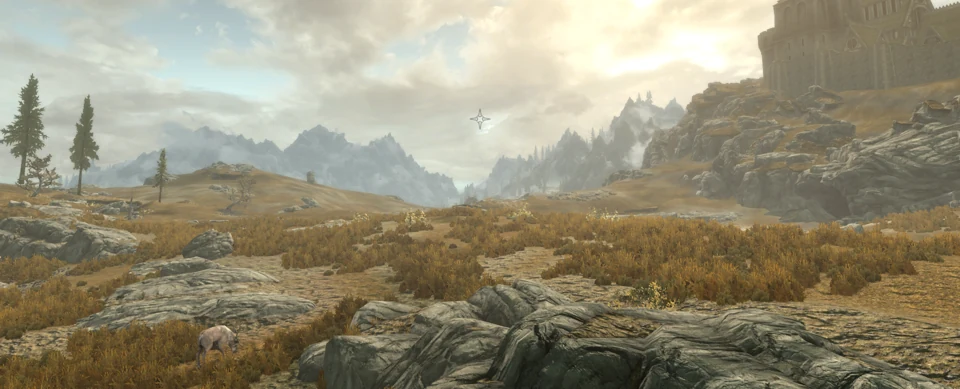
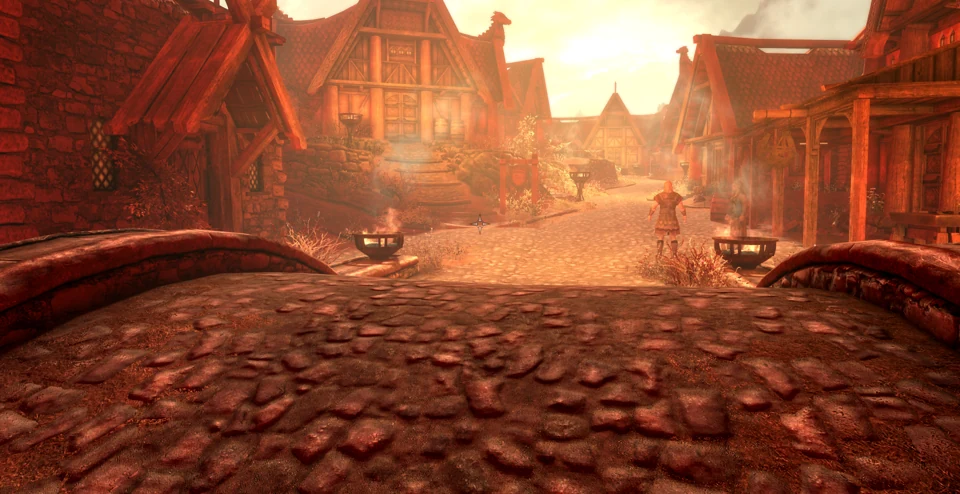
two scenes are the scope. whiterun parks the camera in the middle of the city, surrounded by npcs, fires and buildings. it’s cpu-bound, limited by the game’s main thread. traversal is a no-clip flight across the plains outside whiterun, gpu-bound, limited by the graphics card. two attack angles.
two profiles, this actually matters:
- strict adds no temporal reuse. its design contrast is vanilla’s exact image, where each change is either bit-identical or checked against vanilla by a named component test.
- perf-max allows temporal reuse. slow-moving effects (volumetric light, far shadow cascade, the water reflection cube) update every second or third frame while the camera holds steady. ⛔️ the image is not pixel-identical to vanilla.
- bit 8 must be set in nvidia inspector, more on that later.
under strict, whiterun is level with native and the traversal trails by about 5.5%, for reasons explained near the end. under perf-max the fork takes both scenes. whenever this report says “beat native”, perf-max is meant.
day zero
performance was not the original main goal. ray tracing was.
the opening project was performant real ray tracing in skyrim se: ray-traced sun and light shadows, at least two bounces of global illumination, and reflections. the template was blessed minecraft, a minecraft mod built earlier. it runs two-bounce path tracing through voxels in about 3 to 4 ms on an rtx 3060 ti at 1080p.
nvidia rtx remix looked like the obvious tool, but we dropped it on the first evening. we decided we build our own tracer in a dxvk fork. under dxvk, skyrim’s gpu buffers are already vulkan buffers. every vertex buffer and index buffer the game creates lives inside dxvk’s memory as a VkBuffer. a ray tracer inside the fork can therefore build its acceleration structures straight from the game’s own geometry // export ❌, second copy of the world ❌ second renderer ❌. remix would have to pull every mesh out and upload it again while we get to skip it.
skyrim’s rasterizer keeps drawing everything you see directly: materials, sky, water, ui. the tracer takes over only the secondary rays, meaning shadows, bounced light and reflections.
the first night went fast:
| 2026-09-22 20:50 | boot | skyrim boots on our own dxvk fork. msvc built it in 89 seconds, no patches |
| 2026-09-22 20:55 | rq | ray queries live on skyrim's vulkan device |
| 2026-09-22 21:28 | rays | first hardware rays inside skyrim. two hits, two misses, as the geometry says. main menu at 61.1 fps |
| 2026-09-22 23:10 | sun | sun shadow-mask pass found (pixel shader b070feb5, pass 111 of 185) and forced to zero. we own the sun |
| 2026-09-23 00:24 | light | first light. traced sun shadows from 600 blas and an 884-instance tlas, one ray per pixel, 0.79 ms gpu |
forcing that mask to zero from inside the fork at 23:10 removed all direct sunlight from whiterun. by 00:24 the traced shadows were coming from 600 bottom-level acceleration structures and an 884-instance top level, rebuilt every frame from the game’s own buffers.
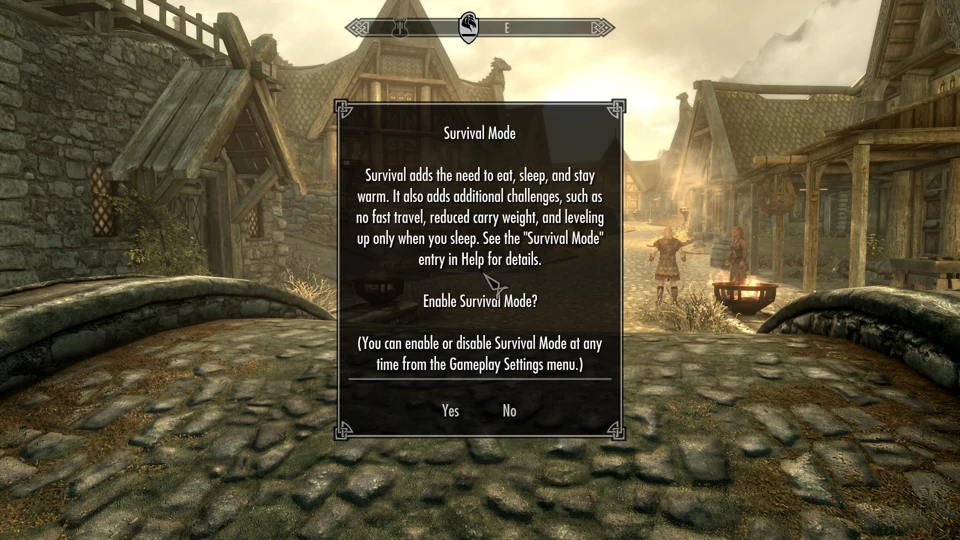
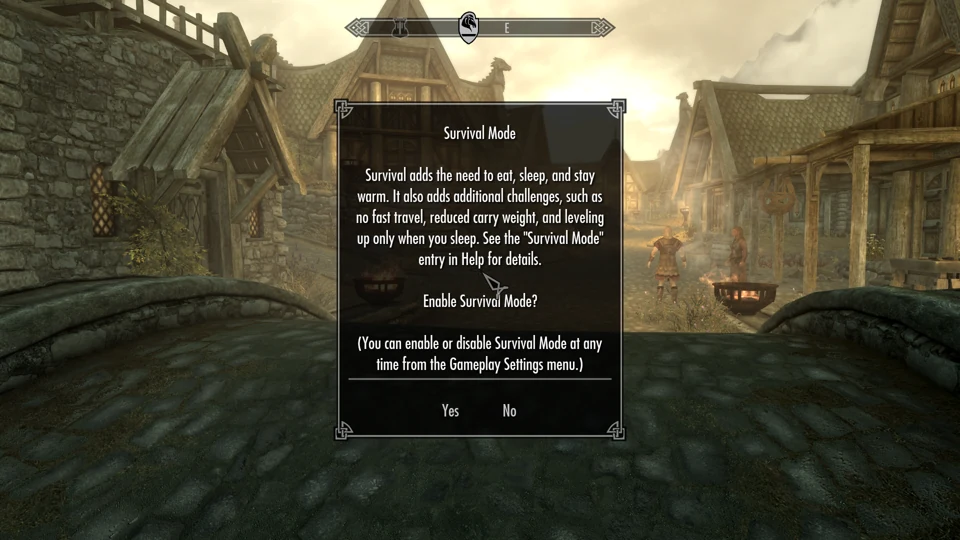
the sun direction we read from shader constant ps b2 c0 made for dramatic shadows. they also moved on their own, because that constant was not the sun. it held the shadow filter’s per-frame noise rotation, spinning around the vertical axis. the real sun sat 18 registers later at ps b2 c18, steady at (0.764, 0.085, 0.639). against the real sun the traced mask matched vanilla’s to 3.4/255 mean difference.
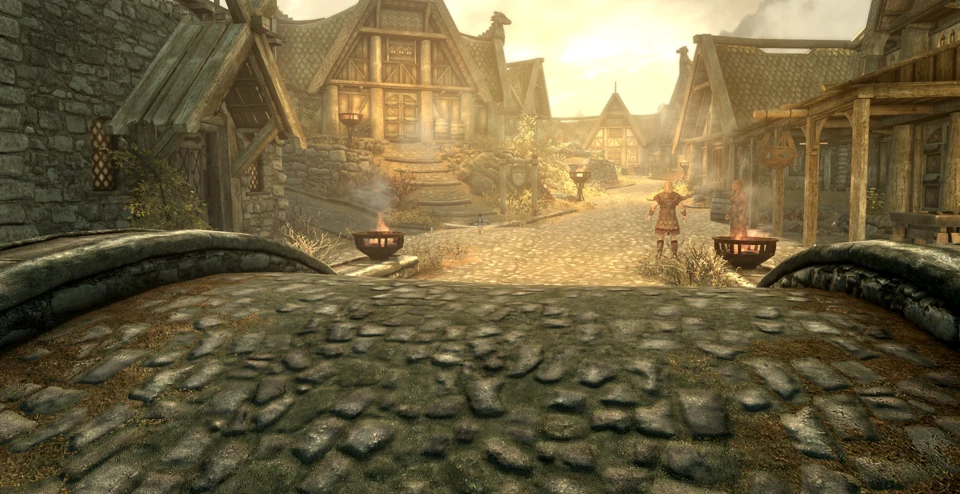
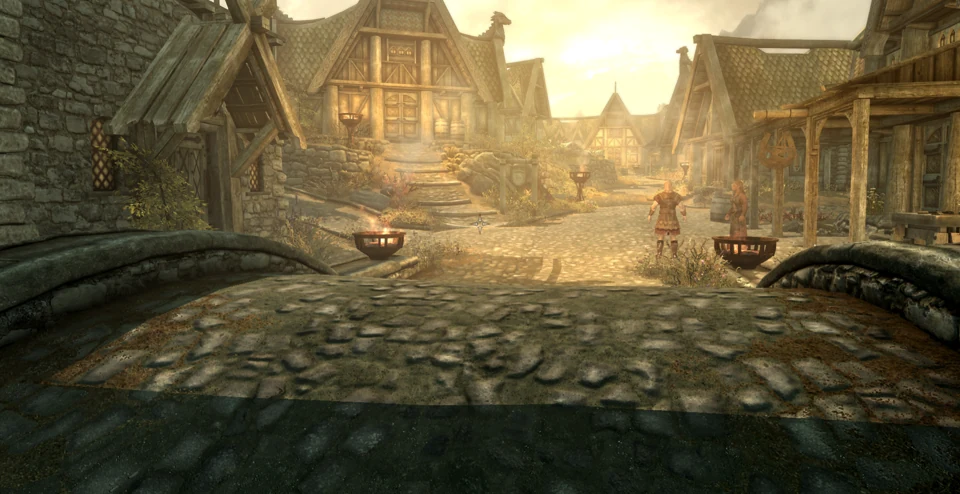
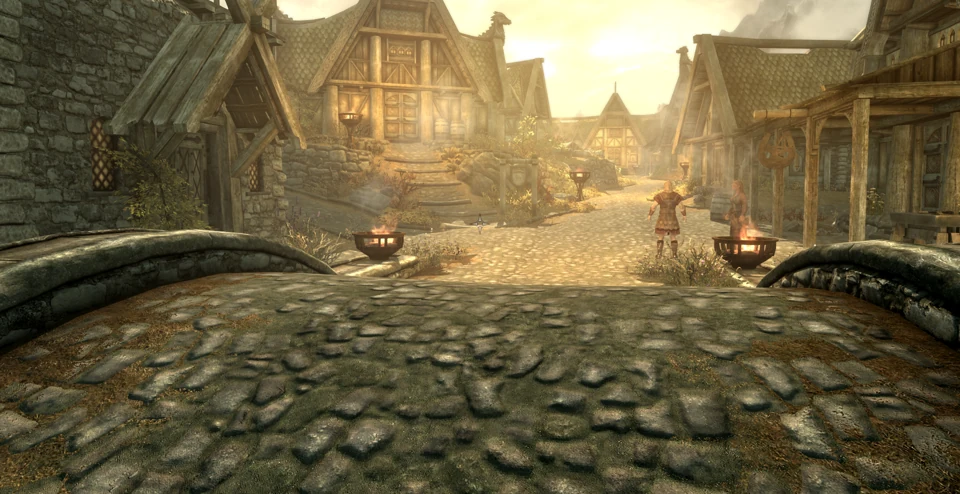



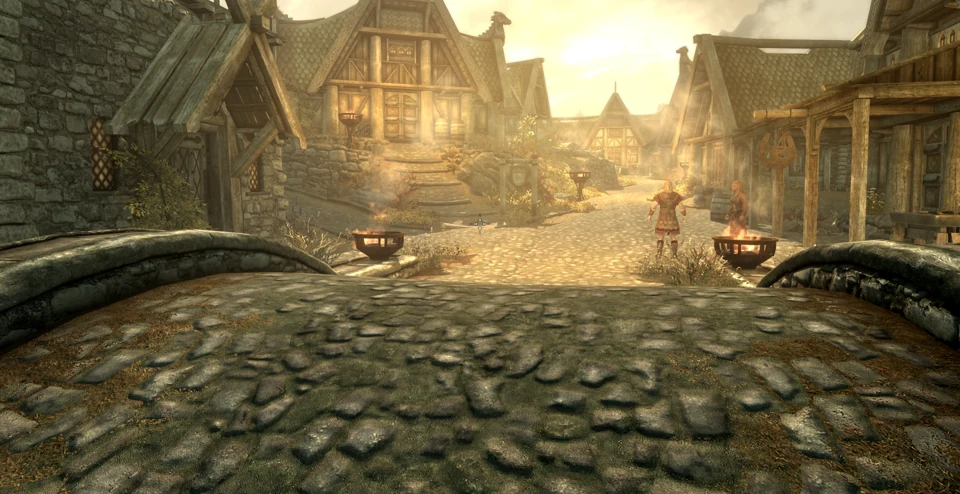
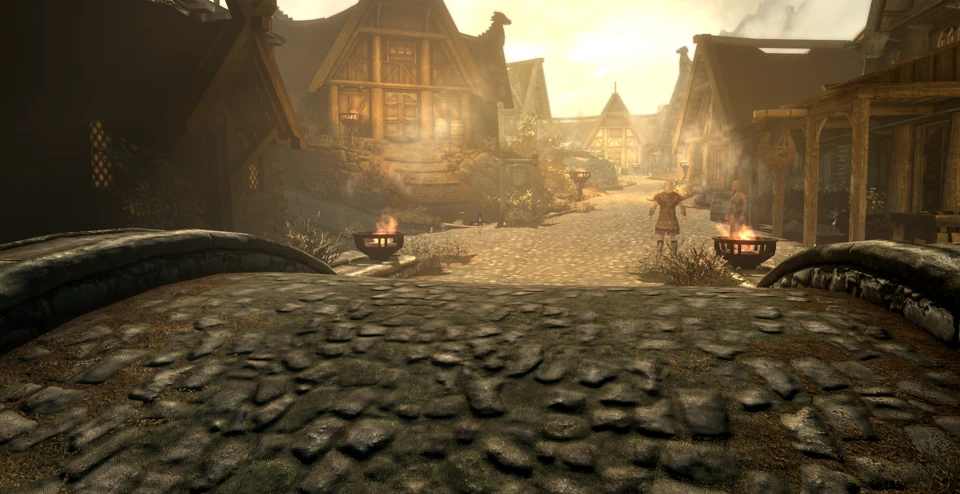
campaign c2 brought something great with it. inside our fork the plugin skipped the 2,559 raster shadow-cascade draws that the traced shadows replace. gpu busy time barely moved, 6.04 ms against 6.07 ms with vanilla’s shadow maps in a scene capped at 60 fps(😔). ray-traced sun shadows came in at about zero cost.
the render-thread crisis
c3 assembled the whole stack, and frame rate fell from 61.0 to 57.7 fps, falling under skyrim’s own 60 fps cap. the gpu sat busy only 6.61 ms per frame. something on the cpu was stalling.
a custom in-driver probe found the stall. DrawIndexed was eating 4.1 ms per frame on the game’s thread. the gi readback ring lived in write-combined memory, which the gpu writes quickly but the cpu reads at a crawl. moving the ring to cached memory brought the frame back to 60.9 fps.
removing the 60 fps cap (c4) exposed a steep cliff to climb:
| backend | fps, uncapped |
|---|---|
| native dx11 | 222.7 |
| stock dxvk | 163.5 |
| our fork, features off | 85.4 |
| our fork, full ray-traced stack | 65.8 |
with every feature switched off, our fork ran at half the speed of stock dxvk, which is already well below native, yet the probe claimed the game thread spent only 0.20 ms inside dxvk per frame. that figure was wrong, there was no way; the probe was lying: it rounded every call duration down to whole microseconds, so a 50 ns dxvk call read as zero. the probe itself also added 4.6 ms per frame, which the 60 fps cap had been hiding. four campaigns of “dxvk’s front end is cheap” were built on a broken instrument.
a fixed probe (raw tsc ticks, calibrated, its own cost subtracted) told the truth. skyrim spends 2.1 ms per frame inside dxvk, not 0.29 ms, and our hooks were adding 2.6 ms of their own.
one morning of surgery followed:
- the first rounds copied bones into a per-frame arena, lifting 101.1 to 109.6 fps.
- next round named the cost. reading 3,840 bytes of skinning bones from a mapped constant buffer ran 7.6 µs per draw, about 500 MB/s, because those bytes were cold.
- stopped reading them on the cpu. the skinning shader reads each draw’s own constant buffer by device address, reaching 118.7 fps.
- one more round measured neutral, and we reverted it.
- moving the gi ambient patch onto dxvk’s worker thread reached 131.0 fps, and moving the static scene capture there as well reached 143.5 fps.
the lesson written down that morning held for the whole project. what cost on skyrim’s thread was cold-cache latency, not instructions. making hooks cheaper for two rounds recovered 17 fps, while moving the same work to another thread recovered about 25 more. campaign c10 closed the morning at 139.1 fps for the full ray-traced stack, up from 101.1 at dawn. native ran 221.5 and stock dxvk 164.1. still a ways to go, but we are making progress.
numbers i can trust
after two major issues i built a real benchmark harness, and by the end of this project had produced 2,370 runs across 80 campaigns. it captured 12,640,563 frames (about 19.3 hours of gameplay) and 30 GB of data. i also keep runs that failed, which i store as more data.
bench/skybench.py launches skyrim through skse and stages the backend, whether native, stock dxvk, or a fork build, along with ini files and mods. it loads a save through the console and waits for the scene to settle. then it captures 30 seconds with presentmon and nvidia-smi and restores the game folder from a journal afterward. every file gets recorded before the harness touches it. if a run crashes, --restore replays the journal. if a file changed in a way it did not expect, the harness refuses to delete it and asks an operator.
bench/campaign.py runs paired, interleaved campaigns. each repeat walks through every configuration, native included. the next repeat walks back in reverse order. that way slow drift (a warming gpu, a background task, the room) hits all sides about equally. the first repeat serves as warm-up and after gets dropped.
 repeat 1   a → b → c      warm-up. dropped
 repeat 2   c → b → a      reverse order
 repeat 3   a → b → c      forward again
 repeat 4   c → b → a
   …        alternating to the end of the plan

 native is one of a, b, c in every campaign
 slow drift lands on every side about equally
 headline: the average % gap to native over
           the paired runs, with a 95% range
headline results are the mean of the paired percentage differences, with a student-t 95% confidence interval. other numbers here (medians, single diagnostic runs, synthetic tests) carry a label saying what they are. one audit caught that we had used the wrong t-value for five pairs, 2.57 instead of 2.78. the right one was used from then on.
the gates grew out of failures, one at a time:
- device loss. a run whose dxvk log shows
VK_ERROR_DEVICE_LOSTfails, even when presentmon kept some frames. one run lost the gpu, kept 2.3 seconds of frames, and reported a fake 228.7 fps. - coverage. capturing less than 85% of the window fails the run.
- stalls. any frame interval over one second fails the run.
- contamination. a run fails when a compiler, or any program started from a seat’s worktree or our scratch folder, ran during the capture. one campaign had nine build seats compiling in the background, and native swung from 212 to 100 fps.
- screenshots. every run’s screenshot is classified for sun shadows, a gate born from our best near-miss. an allocator experiment reported a +18% win, but the screenshot looked like a different camera angle with an unlit wall. same angle, in fact, with the ray-traced shadows silently missing, because the allocator’s null allocation left the gpu less work to do. that number nearly snuck into the reports.
runs taken solo after an idle machine are void as well. one such run put our fork at +51% over native. and it was not noticed immediately that native’s gpu had not clocked up yet, reading 1,703 MHz at 83 W against 1,890 MHz at 132 W once settled.
the cpu war
dxvk has a traditional weakness on cpu-bound dx11 games, and skyrim is a hard case even among those. its renderer makes about 13,000 Map(DISCARD) calls per frame, 12,990 in our probe count. tens of thousands of other d3d11 calls join them, all on one thread.
there is no separate render thread; community writeups describe skyrim’s “render thread” as a second thread beside the game logic, but our thread census found exactly one os thread doing everything. Main::Update (ai, papyrus, animation, havok) and Main::Render (culling, draw submission) run one after another on it, taking about 4.4 ms per frame in whiterun. a sampled cpu profile attributed about three-quarters of that (75%) to the engine’s own Main::Render. the six job workers, meanwhile, burn two full cores spinning with no real work queued.
three weapons won the war.
the constant-buffer ring. previously each Map(DISCARD) allocated a slice from dxvk’s general allocator and emitted its own command. the ring instead hands each frame one big, persistently mapped buffer. a map becomes a pointer bump, and the “rename” rides along on data dxvk was sending anyway. we had estimated 0.5 to 0.8 ms of savings but measured 1.7 ms per frame, for +33% fps. most of the gain came from contention removed around the calls, not from the calls themselves.
the cascade walk. even when the new traced shadows replaced the raster sun cascades, the engine still walked every shadow caster on the cpu. our first fix skipped the whole walk and earned +25.6% fps. it also removed every sun shadow in the game, because the engine sets the sun’s shadow-receiver bit on geometry during that same walk. the correct fix skips only the sun’s caster queueing while keeping the walk, and keeps +20.7% with the shadows intact.
custom threaded front end. nicknamed “the cursed one”, it borrows an idea from mesa’s gallium drivers and wine’s wined3d. every eligible d3d11 call gets recorded into a lock-free ring on skyrim’s thread, at an estimated 5 to 8 ns per call. a second thread then replays it into dxvk’s real state tracking and vulkan recording. buffer writes still return at once on the game thread because allocation is already thread-safe. the design required deferred release and no atomics on the hot path. each buffer also keeps two copies of its current pointer, one for the app and one for the replay thread.
 skyrim's thread                      replay thread
 ┌────────────────────────────┐
 │ eligible d3d11 call        │
 │  record into lock-free     │
 │  ring, 5 to 8 ns per call ─┼──→ replay: dxvk's real state
 │                            │    tracking, vulkan recording
 │ buffer writes return at    │
 │  once (allocation is       │    each buffer keeps two current
 │  already thread-safe)      │    pointers: one app, one replay
 └────────────────────────────┘
 deferred release. no atomics on the hot path
on 2026-09-23 at 15:20, campaign c21 ran the cpu-bound case (720p, low settings):
| backend | fps | 1% lows |
|---|---|---|
| native dx11 | 345.0 | 267 |
| our fork (ring + threaded front end) | 354.7 | 277 |
| stock dxvk | 269.5 |
we beat native dx11 on the cpu by +2.8%, one day in, while stock dxvk trailed native by 22% in the same test. precision matters here, since the repeat that evening (c23) came out a tie inside the noise (-1.1%). the fair summary is “level with native on the cpu, one day in”. at ultra 1080p the story differed, because that scene is gpu-bound and native still led, 205.0 against 192.1 fps, -6.3%, in c23. the gpu track came next.
this front end also produced our best bug. roughly one run in ten crashed silently, starting from a build two days earlier, and a crash-time dump of the ring exposed the cause. when an allocation ended exactly on a lap boundary of the 4 MB ring, a packet’s write limit jumped a whole lap ahead. the packet grew past the end of the ring and wrapped. the replay thread walked into zeroed memory, read it as a constant-buffer rename of a null block, and crashed with 0xc0000005. a model of the allocator counted 56 boundary crossings per 4 million steps before the fix and zero after. in 32 loading-screen runs there were 5 crashes before the fix and none after.
the present path
next came latency, and a driver setting nvidia does not document turned it all around.
on the first night we noticed native skyrim presents through hardware independent flip, the fast path where the gpu flips straight to the screen. dxvk presented through “composed: copy with gpu gdi”, a slow path where the desktop compositor copies every frame. display latency for dxvk sat at about 25 ms, against native’s under 10.
nvidia’s driver offers a “Vulkan/OpenGL present method” setting that can present vulkan through the driver’s own dxgi swapchain (“layered” present). turning it on changed nothing. the driver detects dxvk and refuses to layer it, unless a hidden profile setting is also set: “Vulkan/OpenGL Present Method - Flags” (0x20324987). nvidia profile inspector lists a value for it, 0x00080004 (“allow promoting DXVK to DXGI/DirectFlip”), and that value unlocks it. campaigns c17 and c18 measured the outcome at display latency 24.3 ms to 7.9 ms, level with native’s 9.6 ms, on hardware independent flip.
that campaign also found a free gain in the compiler. the llvm-mingw (clang) build of the fork ran 3.4% faster than the msvc build of the identical source (154.0 against 148.9 fps). it became our default build.
bit 8 arrived after that. scanning the same flag bit by bit on top of the working value surfaced one more bit that mattered. 0x00080104 keeps the independent flip and cuts the gpu’s idle at frame start from 0.365 ms to 0.013 ms. in game that meant display latency 11.5 ms to 5.5 ms plus 1.8% fps, against native’s 10.0 ms. from then on our fork has put frames on the screen sooner than native dx11 in every campaign. its neighbour, bit 18, is a trap that looks similar yet forces the slow composed path (29.2 ms).
| setting | presentation path | latency | note |
|---|---|---|---|
| native dx11 | hardware independent flip | under 10 ms | |
| dxvk, stock | composed: copy with gpu gdi | about 25 ms | |
| layered, flag off | driver refuses dxvk | no change | |
0x00080004 | independent flip | 24.3 → 7.9 ms | c17, c18 |
0x00080104 (bit 8) | independent flip | 11.5 → 5.5 ms in game | +1.8% fps; idle at frame start 0.365 → 0.013 ms |
| bit 18 | forces composed path | 29.2 ms | trap |
bit 8 does not remove the cost of handing a frame to the display, it moves the cost elsewhere. campaign c48 measured every pass against native, and the whole frame came out only 0.15 to 0.18 ms heavier than native. 72 to 74% of that gap sat in one pass, the 4096x4096 sun cascade depth map. the present hand-off lands inside whichever gpu pass happens to be running at the time, and it most often takes the longest pass.
the way we measure latency matters. both numbers come from presentmon’s DisplayLatency; each backend is read on its own presentmon clock, which start at different points. on native the frame starts when skyrim’s own previous Present returns. on our fork it starts when nvidia’s layered swapchain presents on dxvk’s submit thread, after the frame was already replayed. presentmon’s GPULatency makes the difference apparent: 0.5 ms on our fork against 5.4 ms on native in whiterun. our number leaves out up to about two frames of queue. in whiterun, which is cpu-bound, the queues drain and “half” is plausible. in the traversal, which is gpu-bound, it is not proven. what holds is that the fork presents on the same fast hardware flip path as native.
we tried settling it on a shared clock. presentmon can time input to photon from the os input timestamp, so we tapped scroll lock every 250 ms during a capture. the taps never registered (0 of 6,231 frames), likely because skyrim reads its keyboard through directinput. a camera-based click-to-photon test is needed.
a correction, then ahead
two more levers closed most of the remaining gpu gap in whiterun.
the constant-buffer mirror. skyrim writes constant buffers to fast, cpu-cached ram that the gpu reads slowly. the obvious fix is placing the ring in vram with resizable bar. we built it and measured -30%. every locked cpu write to write-combined vram stalls about 200 ns while it drains over pcie, and skyrim performs about 13,000 of them per frame. the mirror keeps the cpu writes in cached ram. the gpu’s transfer queue then copies each used range into vram, in parallel with the graphics work. across 600 frames it moved 7.66 million renames with zero cpu reads and zero lookup misses, worth +2.8%.
vb rebar. dynamic vertex and index buffers get written in bulk and in order. write-combined vram handles that well // resizable bar is a gain for those buffers. a full-screen glare shader that read a 4 MB streaming buffer about 12.6 times per frame clued us to this angle.
campaign c53 then claimed a tie at ultra 1080p in whiterun, 219.0 fps against native’s 218.9. the 1% lows were 178 against 172, and presentmon display latency 5.1 ms against 9.6 ms.
an audit corrected it the same day. the median tied, but the mean of the five runs favoured native at 219.6 against 217.9. the perf-max profile already included half-rate volumetrics, so it was not vanilla’s exact image either. the claim and the correction stayed side by side in the log, and strict (visually close or identical to native) was defined because of it. under strict the fork ran 2.2% behind native.
hardware-accelerated gpu scheduling (hags) on helped every backend, but it helped us more: native +2.5%, strict +3.5 to 3.8%, perf-max +4.7 to 5.0%. acceleration off was worth trying but it stays on; hags off ended up decreasing frames for native and our fork.
campaign c58, on 2026-09-26 at 03:20, delivered the first paired success at ultra: +1.23% (95% ci +0.38 to +2.07, 8 of 10 pairs). latency was 5.2 ms against 9.5 ms. the same campaign surfaced a strange effect in dxvk’s descriptor buffers, which warm up across runs in one session: 205.5 → 209.4 → 216.9 → 215.9 → 211.4 → 202.6, then 219.2 → 216.0 → 218.1 → 219.2 → 219.0. a single warm-up run proved insufficient, and the standing rule is now roughly six runs of warm-up after any driver or dll change.
two exact shader replacements pushed further. the fork can swap a hand-written shader in for any of skyrim’s, matched by content hash. two blur shaders received bit-identical replacements (128 of 128 dispatches identical), worth +1.1%. vanilla’s volumetric-generate compute shader ran as 32x32 thread groups. the compute shader was rewritten as 8x8 with a matching dispatch and byte-identical output, plus a deliberately broken negative control to prove the check works. its dispatch fell from about 0.5 ms to 0.335 ms. with it, the whole perf-max stack reached +2.35% over native in whiterun, and the shader’s share of that was approximately +0.34%.
dead devices
for about a day, roughly one whiterun run in four lost the gpu device.
suspicion was on a feature called the getter shadow. OMGetRenderTargets and its siblings answered from an app-thread copy of the state instead of asking dxvk. its verification reported zero mismatches in 5.57 million slot comparisons. yet that verification also changed the synchronization it was checking, and it earned no measurable speed. our leading explanation is a lifetime bug: it answered from stale state after a view’s last reference had moved to the worker thread’s deferred release.
numbers spoke:
| getter shadow | whiterun runs that lost the device |
|---|---|
| on | 13 of 47 |
| off, same build | 0 of 12 |
| before the feature existed | 0 of 57 |
the getter shadow was turned off by default and skips its record-time update when off // no device loss has returned since. the lifetime bug was never proven to be the cause, so we say the feature was implicated rather than the bug fixed.
along the way we had blamed one cluster of losses on a stale incremental build, a note that turned out wrong. those runs were bad luck at the base rate of about one in four, and the events were logged and examined. the detour did leave a rule behind: a merge that changes class layouts needs a clean build.
a second instability received the same treatment. async volumetrics (the volumetrics generate on a second graphics queue) ran slower in both profiles, -0.96% and -1.87%. the candidate build also caused four device losses and eight driver resets in under an hour. every driver reset appears as an nvlddmkm event 153 in the windows event log, checked after any risky run. async volumetrics was closed for good, keeping only its incidental bug fixes.
the traversal wall
whiterun fell first; traversal refused to move.
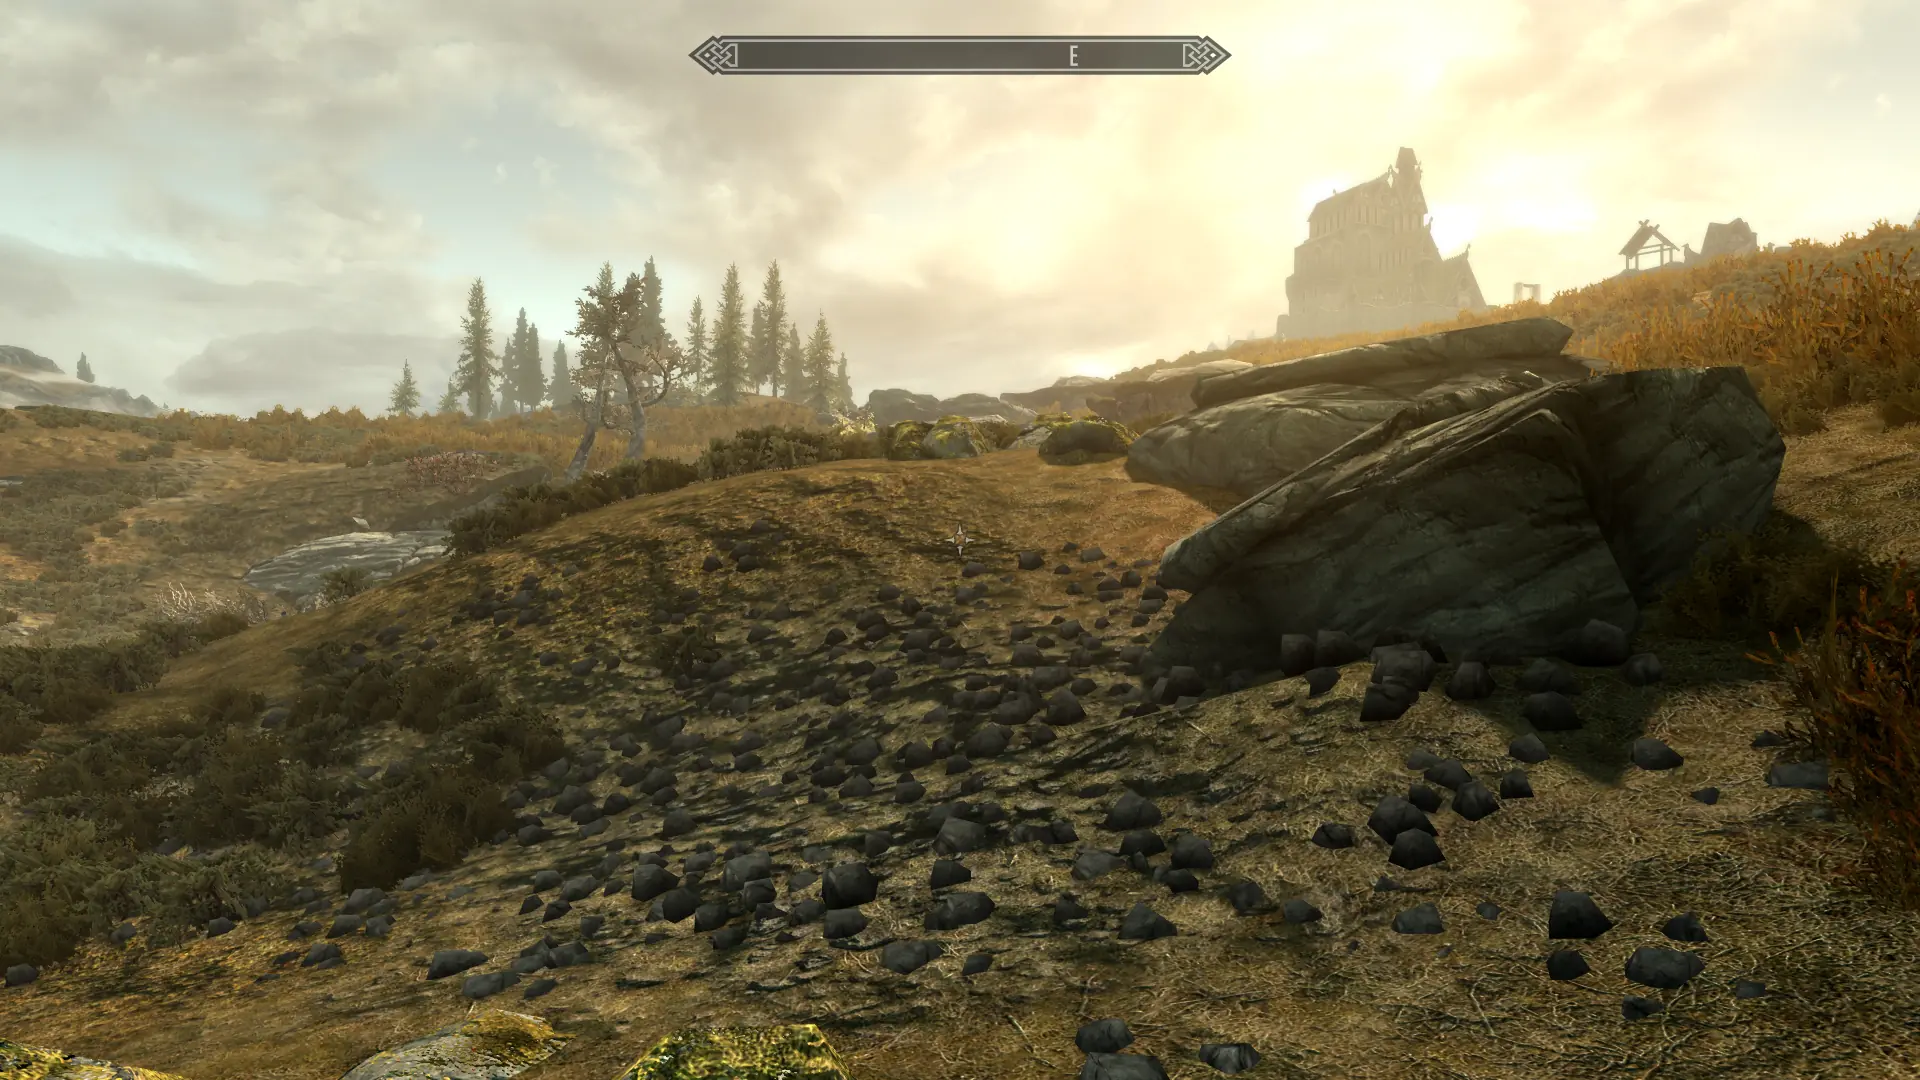
the scene is gpu-bound. at about 4 ms per frame, the layered present hand-off’s fixed cost (about 0.36 ms) weighs far more than at 60 fps. for most of the project the traversal sat 5 to 9% behind native even while whiterun stayed comfortably ahead.
better instruments built for it:
- a per-pass gpu timer wraps a vulkan timestamp query around every render pass.
- a matching proxy dll does the same for native dx11, letting passes compare one to one without pix or nsight.
passdiff.pyaligns two runs pass by pass and lists the biggest deltas.- a layout census counts image layout transitions and barriers per frame.
- a “gaps” timer splits gpu idle time by cause.
those instruments returned an uncomfortable result. audit found that the per-pass floors already sum to about zero. in the best frame of each 120-frame window, our wins (the volumetric collapse, the blur replacements, the transfer-queue uploads) outweigh our fixed losses. the strict traversal gap of about 0.24 ms per frame fits the tail of the driver’s present hand-off. that tail lands in three passes of the following frame: the depth prepass, the far cascade and the volumetric generate. the 0.24 tail was incredibly difficult to isolate.
audit additionally landed two submission-structure leads:
- zero-copy present (c67). the fork acquires the swapchain image early and points skyrim’s final draws straight at it, so the present blit disappears. worth +0.73% in the traversal, roughly the 0.03 ms the blit itself took.
- flush at render-pass end (c70). dxvk flushes work to the gpu on internal heuristics without knowing whether a render pass is open. dxvk counted 86 to 88 render passes per frame where our pass timer counted 83. the difference was cutting implicit flushes in half. deferring those flushes to the next render-target change earned +1.48% in whiterun (+3.51% over native at that point).
and the list of things that measured null in the traversal kept growing:
- a fourth swapchain image
- a fix to the water cube’s shared depth
- unified image layouts, where the census counted about 170 layout transitions per frame at no measurable price
- sdma routing, whose counters read zero pending uploads
- a fragment-shader framebuffer copy, worth -0.019 ms in a synthetic test and nothing in the game
what this left us, for this rig and five-pair campaigns, is that savings under about 0.03 ms rarely appear in the frame // changes to submission structure do, and so does temporal reuse. zero-copy sat at about 0.03 ms and did appear, just barely.
perf-max cracked traversal w temporal levers
we went where the frame time lives: work that repeats every frame without much need.
half-rate volumetric light (with a motion gate) ranked among the first perf-max levers, worth about +5.5% early on. the volumetric collapse folds vanilla’s 90 or so volumetric dispatches into one // bit-identical, from 0.41 ms to 0.14 ms.
half-rate water reflections (c73). skyrim renders a small cube map for water reflections every frame. the first version updated it every other frame. that delivered the first traversal win in the project: +1.23% over native (+0.40 to +2.07, 5 of 5 pairs). before we shipped, audit flagged that the reflection-target detection was too broad and had no motion gate. the hardened version, used from c76 on, narrows the detection and adds motion and age gates. it also adds a relaxed turn gate // a reflection cube does not change when the camera exclusivly turns.
the half-rate far cascade (c74). the far sun cascade (cascade 1 of the 4096x4096 atlas, ~2,280 draws in whiterun) re-renders every frame. on a reused frame our plugin skips it. the plugin also freezes that cascade’s camera, matrices and split data. that way the shadow mask and the volumetric generate read the depth with the same matrices it was rendered with. our first model of the cascade box failed because the engine scales it by 8, and a seat found and fixed that. unexpectedly this is a cpu gain // a reused frame skips ~2,280 caster registrations on the game thread.
sun tolerance (c75). while flying, the sun direction jitters by a hair every frame. at zero tolerance the cascade reused 48 of 7,202 frames, while a tolerance of 0.05 degrees reused 3,672 of 7,345, which is every other frame. the outcome was whiterun +11.26% and traversal +2.99%.
period 3 volumetrics (c76). the volumetric generate runs every third eligible frame instead of every second, adding up to 1.8% on top.
the c76 stack ended, and those are the numbers at the top of this report. all 48 of its runs passed every gate, with no device loss and no flagged contamination.
the ladder
the whole ladder in one place:
| backend (whiterun, ultra 1080p) | where it landed |
|---|---|
| stock dxvk 3.1.1 | 161.8 fps in c80 against native’s 219.0: -26.13% in whiterun, -14.57% in the traversal, 0 of 5 pairs each |
| our fork, “perf” (cb ring + threaded front end) | already +27.6% over stock dxvk by c23 |
| our fork, strict (vanilla’s exact image) | level with native in whiterun, about -5.5% in the traversal |
| our fork, perf-max | +10.97% over native in whiterun, +4.37% in the traversal (c76). repeated in c80: +12.09% and +4.04%, which is 1.52x and 1.22x stock. lower presentmon display latency |
mod fight
we finally got to the moonshot, not even a week later. the next question: could a player install several performance mods on native dx11 and dust us, and could our fork run those same mods?
both sides got the same mods, and we ran everything again.
display tweaks (c77) runs cleanly on our fork, and the fps lead holds. with it on both sides, whiterun reads +12.07% (+11.04 to +13.10) and the traversal +4.12% (+3.55 to +4.69). native’s median sat about 1.0% higher in whiterun and 0.5% higher in the traversal than in c76. that is a cross-campaign reading, not a paired display tweaks on/off run. the 1% lows narrow under it. display tweaks lifts native’s whiterun 1% low from 164 to 174 (ours 179), and in the flight the 1% lows are level at 217 against 215. display tweaks also enables dynamic havok timestep scaling (60 to 240 fps) on both sides, so the physics stick to each side’s own frame rate.
community shaders (c79) is the big one. it replaces most of skyrim’s lighting with its own shaders and adds effects like screen-space gi, skylighting and volumetric shadows. the price is ugly: native falls from about 218 to about 103 fps in whiterun. we ran the same mods on both sides, engine fixes (which it requires) and display tweaks (which uncaps native under it, see the traps below):
| scene | native + cs | our fork + cs | paired difference (95% ci) | 1% lows |
|---|---|---|---|---|
| whiterun | 103.1 fps | 120.3 fps | +16.64% (+16.41 to +16.86), 5 of 5 pairs | 85.8 vs 114.4 |
| flying traversal | 151.8 fps | 161.0 fps | +6.05% (+5.52 to +6.57), 5 of 5 pairs | 117.8 vs 151.3 |
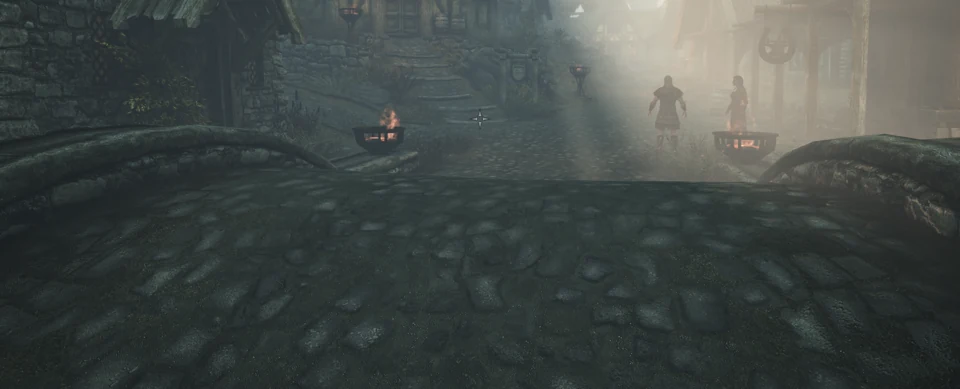
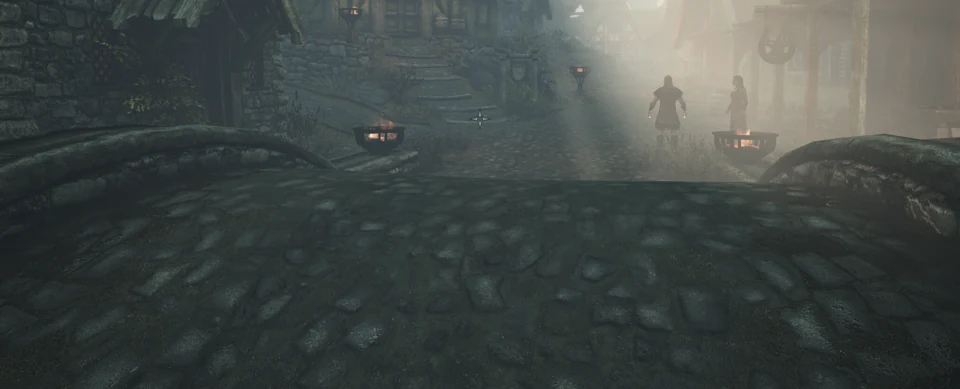
under community shaders the lead grows. its effects pile more load onto the cpu and the driver, where our constant-buffer ring and threaded front end help most. the images match, confirmed by our own screenshot-pair comparison and audits.
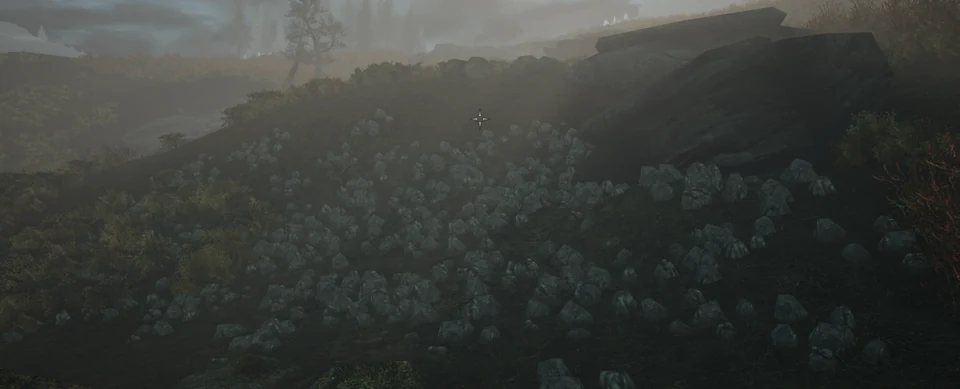

two notes:
- our fork runs with fewer levers under cs. the volumetric collapse never engages because cs replaces the volumetric chain it looks for. the flush lever sits at its cap, though the far cascade reuse still works. native loses nothing from any of this, so it does not favour us. it means the gain comes from a smaller set of tricks than c76.
- native’s 1% lows under cs carry hitches (worst frames of 18 to 20 ms against our 8 to 9 ms) in every repeat. we have not found the cause yet. driver-side shader compiles on native remain our suspect.
no grass in objects (c79), in its live mode, takes nothing measurable from either side. live mode means no cache, ray casting on, and the game’s own grass density. with it on both sides, whiterun reads +12.91% (+9.42 to +16.39) and the traversal +4.50% (+3.57 to +5.43), 5 of 5 pairs each.
two mishaps nearly turned into fake numbers:
- community shaders was silently off. our first community shaders runs looked free, at native’s speed, because its log ended with
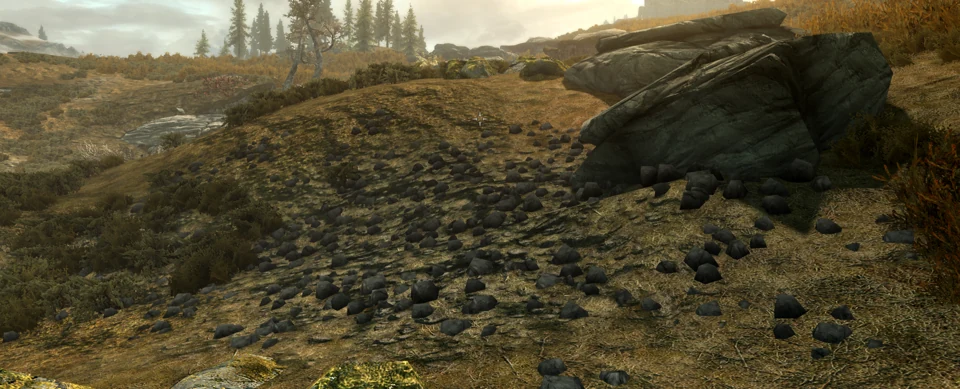
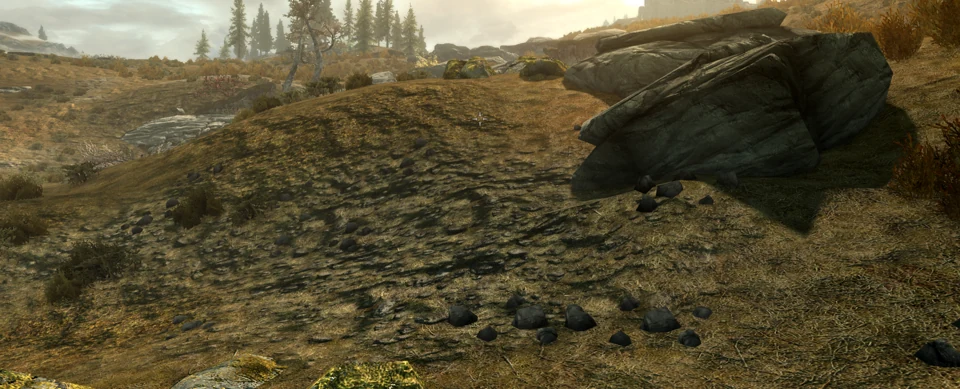
Required DLL Data/SKSE/Plugins/EngineFixes.dll was missing. it loaded and then did nothing. with engine fixes staged, it came on and compiled its shaders before the main menu (3,577 files in its cache). native then ran at exactly 75.0 fps, this monitor’s refresh rate. community shaders rebuilds the swapchain (10-bit, “hardware composed”) without the tearing flag. native could not present faster than the refresh, while our fork presents its own way and was never capped. an uncapped fork against a capped native is no fair fight, so we voided those runs. display tweaks’EnableTearinguncaps native, which is why the real test runs display tweaks, community shaders and engine fixes together on both sides. - the grass cache was sparser than the game. a downloaded grass cache for no grass in objects made native +13% faster in the flight. the screenshot explained why: most of the ground clutter and many bushes were gone. the cache had been built at a lower grass density than our settings, so we do not report it as a mod win // a cache built at our own density is on the list.
blursed
sometimes, we had to use some very normal methods. we kept a ledger of every blursed idea and how each one ended.
for the present path:
- custom d3d12 present bridge. a second, minimal d3d12 device presents a zero-copy import of our vulkan image. it worked in a synthetic test (independent flip, idle down to 0.011 ms). but the d3d12 present still took about 0.4 ms wherever it landed, leaving the books even. one variant produced the best display latency we measured anywhere (8.0 ms at the time), without extra fps.
- windows 11 composition swapchain. dwm stayed black until the buffers were also bound as shader resources, an obscure gotcha we found by bisection. it eventually rendered real content on an independent flip, but it paces at the refresh rate (75 to 77 fps). closed.
- direct scanout, vr style (
VK_NV_acquire_winrt_display). vulkan owns a monitor directly, as vr headsets do, but it needs a monitor removed from the desktop. we proved the extension exists and stopped there. - layered present off entirely. worth +4.5% fps at double the display latency. on a 75 Hz screen latency matters far more than frame time, so it stays off.
- five hidden nvidia vulkan settings, swept across 14 values, with every row landing within 4 µs of baseline. closed in an afternoon.
- fifo-first swapchain creation, a forum trick for the native path. no change on this driver.
- “treat as native” flag values
0x803A5and0x802A5(c63). neither helped, and dropping bit 8 lost about 1.5% while doubling latency.
for the gpu and cpu:
- the cascade cache (redraw only moving shadow casters). at first it cached nothing, an unread
c0register held garbage and every mesh looked “moved”. fixed and exact, it skipped about 1,167 draws per frame and still lost 3 to 4%. the skipped draws were cheap depth-only draws, and about half the cascade (trees in the wind, actors) redraws anyway. parked. - the early mirror split lost the gpu device in 11 of 11 runs for a ceiling of 0.03 to 0.08 ms. parked.
- variable rate shading. the adaptive mode lost 2.3%. the “constant 2x2” row in an earlier campaign had never run vrs at all. the config parser accepted only the literal string
2x2, and fell back to off without an error // audit caught it by reading the parser against the plan file. - water effects at half rate on the cpu. water took 9% of the main thread in our profile. the first version ran 25% slower because it called the engine’s update directly and paid a full update on skip frames // the fixed version was worth at most 1.7%, inside noise.
- thread affinity. the windows scheduler beat every fixed-core layout we set by hand // giving smt siblings to the job workers lost 6%.
- hidden engine ini switches (joblist active-wait, culling-plane optimization, front-to-back prepass, lod z-prepass) // none moved the frame rate.
- reordering
Main::Renderto run the sun cull on a worker. reverse engineering found only 0x146 bytes of setup between the cull stage and the draw stage, and no independent work // it died on paper before making it to code.
shells
- the profile inspector dialog ate a night. a cleanup script split a setting name on spaces and handed nvidia profile inspector a bad path. an elevated confirmation dialog then hung for about 9 hours (😭), from 04:21 to about 13:10. two overnight campaigns stalled until closed by hand.
- game bar isn’t there. xbox game bar is not installed on this build. with game dvr on, windows kept trying to open an
ms-gamingoverlay:link, and a popup stole focus about every 9 minutes. the harness refuses to type into a foreign window, so runs failed without explanation. the steam overlay was hookingPresenton every run as well, and steam’s web helper leaked to 19.5 gb overnight, which stopped both queued chains (again, 😭). game dvr and the overlay are both off now. - a wait loop that waited for itself. a helper that waits for the bench lock turned into a busy spin during captures twice, for two different reasons. once, native read 170 fps instead of 196 to 215. on the last night, a new wait loop searched process command lines for “skybench.py”. it found its own command line and waited on itself for over an hour (… 😭).
- engine fixes writes into its own ini. it fills
EngineFixes_SNCT.iniwith skyrim.esm values at runtime, so the harness’s hash check refused to remove the file we staged. the harness now names that file as game-written. - two cores spinning. with
bJoblistActiveWait=1, skyrim’s six job workers burn two full cores at a still camera with nothing queued. switching it off changed nothing in the frame rate, and we did not prove the spinning actually stopped. - havok is nearly free in a still whiterun, with its workers using negligible cpu in our sampled still-camera run.
- copy that is not provably dead. a late hdr copy looked dead and removable, and we traced it to the first-person render. then the water reflection cube’s faces turned out able to read it. it stays.
- machine noise. twice, whole rounds of runs dipped 20 to 30% in every backend, stock dxvk included. both times the cause was a background job on the machine, not the code.
auditors
every major round of work was audited twice. both audits are read-only, working from committed evidence, campaign results and source at a named commit, and neither sees the other’s draft. eight rounds happened, 16 audit documents in all, and round eight was our last check.
each round paid for itself:
- round one found that presentmon’s cpu and latency columns for the dxvk rows were timing the driver’s submit thread rather than skyrim’s game thread.
- they found that the vrs “ceiling” row had run with vrs off.
- they caught four device-lost runs that had passed the old gate and sat inside a campaign’s numbers // one of them had kept 2.3 seconds of frames and reported 228.7 fps. the harness got its device-loss fix from that audit.
- both auditors, arriving from different directions, reached the same statistical floor. nothing under about 0.03 ms can be judged by a five-pair fps campaign on this rig.
- on the strict traversal gap, one put the odds of any untried idea at about one in five. the other refused to call the tail a proven floor // the status line kept her hedge.
- round eight recomputed c76 and c77 from the raw run files and reproduced both to the second decimal.
look ma i’m benchmaxxing
| what | count |
|---|---|
| benchmark runs with a result | 2,370 (2,144 ok, 226 failed and kept as evidence) |
| campaigns | 80 |
| frames captured | 12,640,563 |
| gameplay captured | about 19.3 hours |
| benchmark data | 30 GB |
| busiest day | 587 runs (2026-09-23) |
| fork commits on top of dxvk 3.1.1 | 300 |
| fork diff | 245 files, +57,759 / -79 lines |
| fork experiment worktrees | 74 |
| main repo commits | 437 |
| skse plugin | 6,595 lines in 32 files |
| campaign plans | 72 |
| seat briefs | 106 |
| audit rounds | 8 rounds, 2 auditors, 16 documents |
| research notes | 43 files, about 133,000 words |
| tuning report | about 18,400 words |
every number in this report has its run id in the tuning report, in blessed-skyrim.
open items
- the strict profile traversal gap. about 0.24 ms per frame, about 5.5%, sitting in the driver’s layered-present tail. the only route to close it is visibility work, such as conservative culling and gpu instance compaction // planned.
- custom grass cache, built at our density, for a fair no grass in objects fight.
- ideas for later: dynamic resolution, frame generation, and the ray tracer itself (stopped at gi v1.1 when we shifted immediate focus to performance.)
- two machine angles not yet tested: gpu preemption, and large pages.
- real click-to-photon latency test, with a camera, since injected key taps do not reach presentmon’s input tracking in skyrim.
- native’s hitches under community shaders. cause not found, with driver-side shader compiles as the first suspect.
thank you
this project started when a very dear friend saw my minecraft work and asked me to optimize their favorite game (you know who you are), and they knew i would take this way too seriously. this project is the output of benchmarking nonstop for days, and despite starting off ~50fps under native, we didn’t stop and finally beat dx11 performance with vulkan :3
a week ago stock dxvk ran whiterun about a quarter slower than native, and it still does. today our fork runs it 11 to 12% faster than native, 1.5 times as fast as stock // it runs on the same fast flip path, with lower display latency on presentmon’s clock.
log
| 2026-09-28 | mods | the lead holds with the same mods on both sides (c77, c79). c80 repeats the headline. round eight audits the writeup |
| 2026-09-27 | both | ahead of native in both scenes, perf-max (c73, c74) |
| 2026-09-26 | ultra | first paired win at ultra, whiterun (c58) |
| 2026-09-25 | level | a tie at ultra in whiterun (c53). an auditor corrects it the same day |
| 2026-09-24 | bit 8 | one more hidden nvidia bit. display latency under native's |
| 2026-09-23 | cpu | ahead of native on the cpu (c21) |
| 2026-09-23 | flag | the hidden nvidia flag: display latency 24.3 ms to 7.9 ms (c17, c18) |
| 2026-09-23 | thread | the ray tracer leaves skyrim's thread (c10) |
| 2026-09-23 | light | first light: ray-traced sun shadows in skyrim |
| 2026-09-22 | sun | the sun's shadow mask, forced to zero from inside the fork |
| 2026-09-22 | rays | first hardware rays inside skyrim's vulkan device |
| 2026-09-22 | boot | skyrim boots on our own dxvk fork |
report: closed. perf-max ahead of native in both scenes, twice. strict still about 5.5% short in flight. every number is attached to its run id.